My first try at using p5.js
I’ve been interested in the p5.js project for years, and watched Daniel Shiffman use it in many a Coding Train video, but I’ve never actually picked it up and used it myself until now!
From the getting started example I noticed that whatever you add to the draw() function gets called on every frame. Perhaps there is a requestAnimationFrame call happening under the hood.
I was thinking I’d do something with a square ‘grid’ filled with triangles. First I set up the canvas.
const size = 400;

function setup() {
	createCanvas(size, size)
}
I’m liking how quick p5 is making this so far. I’ve done plenty of stuff with canvas before but this is certainly quicker than the usual setup of adding the canvas, getting the context, etc.
I tried drawing some triangles. The p5 reference says you use this method to draw a triangle
triangle(x1, y1, x2, y2, x3, y3)where the arguments represent the x and y co-ordinates of the 1st, 2nd and 3rd points of a triangle.
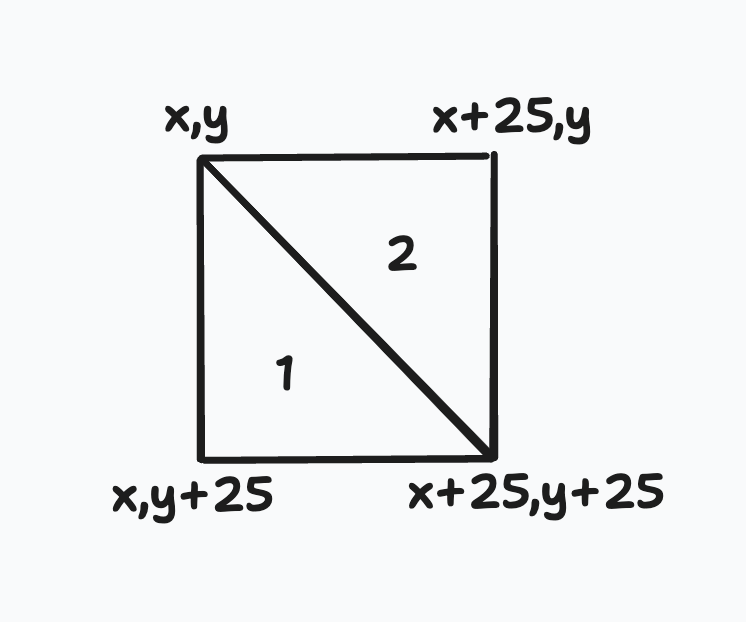
I just needed to calculate the co-ordinates for each triangle. For each “row” (y position) on my grid, I wanted to add two triangles. I calculated the positions of the coordinates based on the top-left corner of the grid square.

I gave them a random colour so I could distinguish them from eachother.
const triangleSize = 25;

function draw() {
	for (let y = 0; y < size; y += triangleSize) {
		for (let x = 0; x < size; x += triangleSize) {
			// first triangle
			fill([random(255), random(255), random(255)])
			triangle(x, y, x, y + size, x + size, y + size)
			// second triangle
			fill([random(255), random(255), random(255)])
			triangle(x, y, x + size, y, x + size, y + size)
		}
	}
}
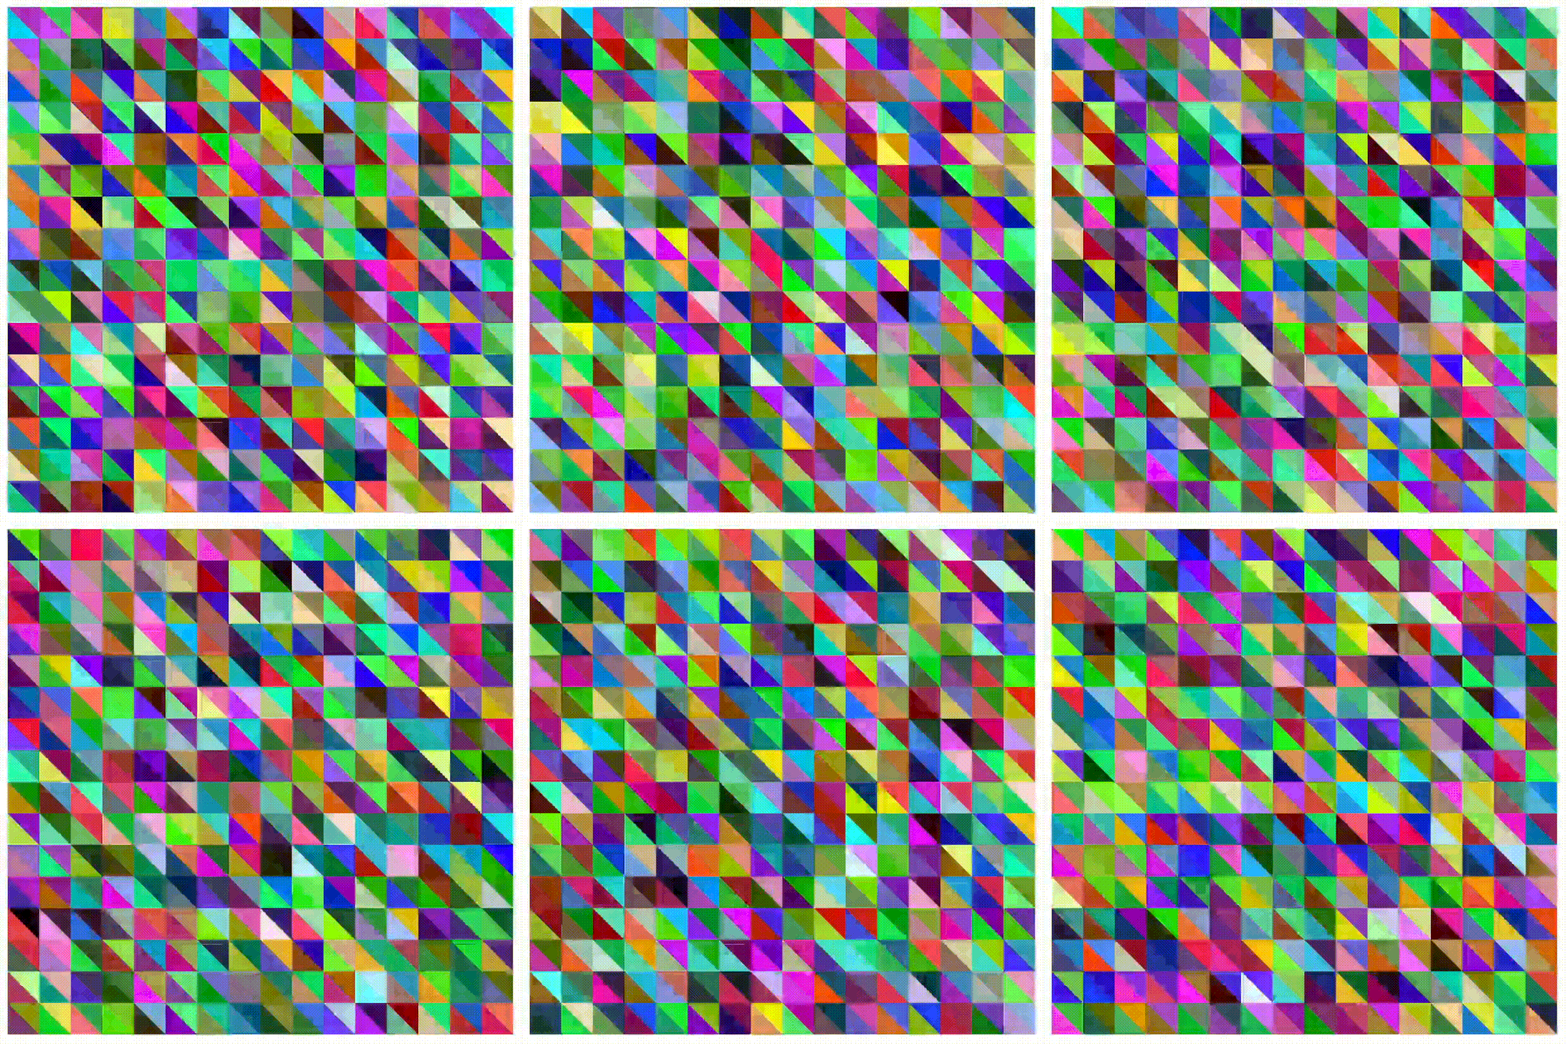
That created something that looked like this:

Whoops, I forgot about the “draw() being called on every frame” thing, lol. I do want my triangle colour to animate, but not as chaoticly as this. I’d have to add some JS objects to contain and control the properties of my triangles.
I added some setup code to create an object for each triangle, and store the triangle in an array. Then that array is used in the draw function.
function setup() {
  createCanvas(size, size);
  for (let y = 0; y < size; y += triangleSize) {
    for (let x = 0; x < size; x += triangleSize) {
      triangles.push(...makeTriangles(x, y, triangleSize));
    }
  }
}

function makeTriangles(x, y, size) {
  return [
    {
      x1: x,
      y1: y,
      x2: x,
      y2: y + size,
      x3: x + size,
      y3: y + size,
      color: [random(255), random(255), random(255)],
    },
    {
      x1: x,
      y1: y,
      x2: x + size,
      y2: y,
      x3: x + size,
      y3: y + size,
      color: [random(255), random(255), random(255)],
    },
  ];
}

function draw() {
  noStroke();
  for (const t of triangles) {
    fill(t.color);
    triangle(t.x1, t.y1, t.x2, t.y2, t.x3, t.y3);
  }
}
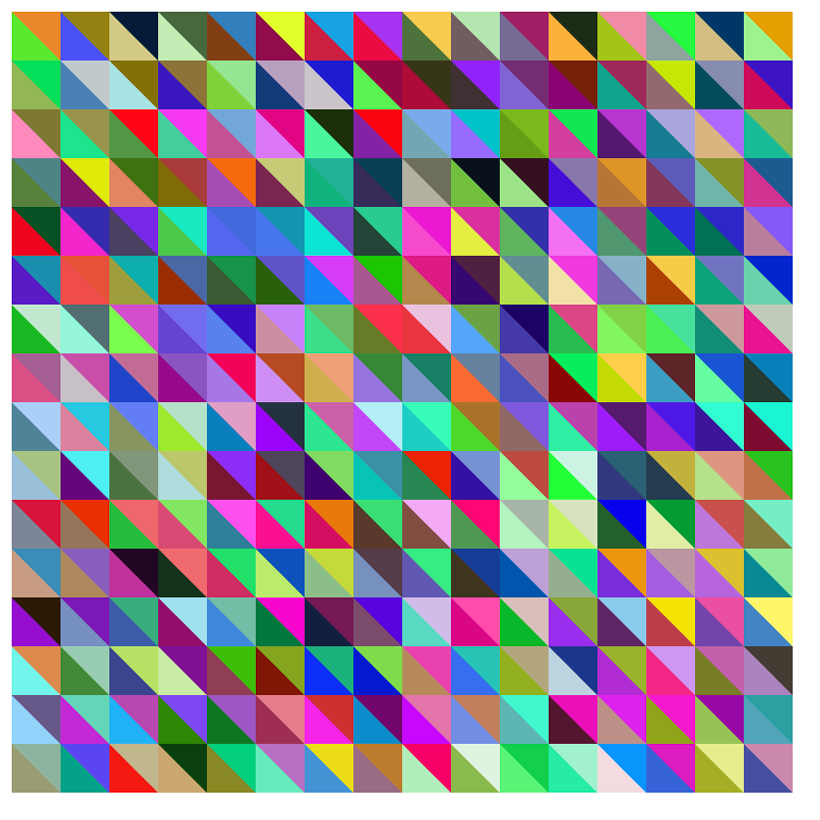
That makes my grid look like this.

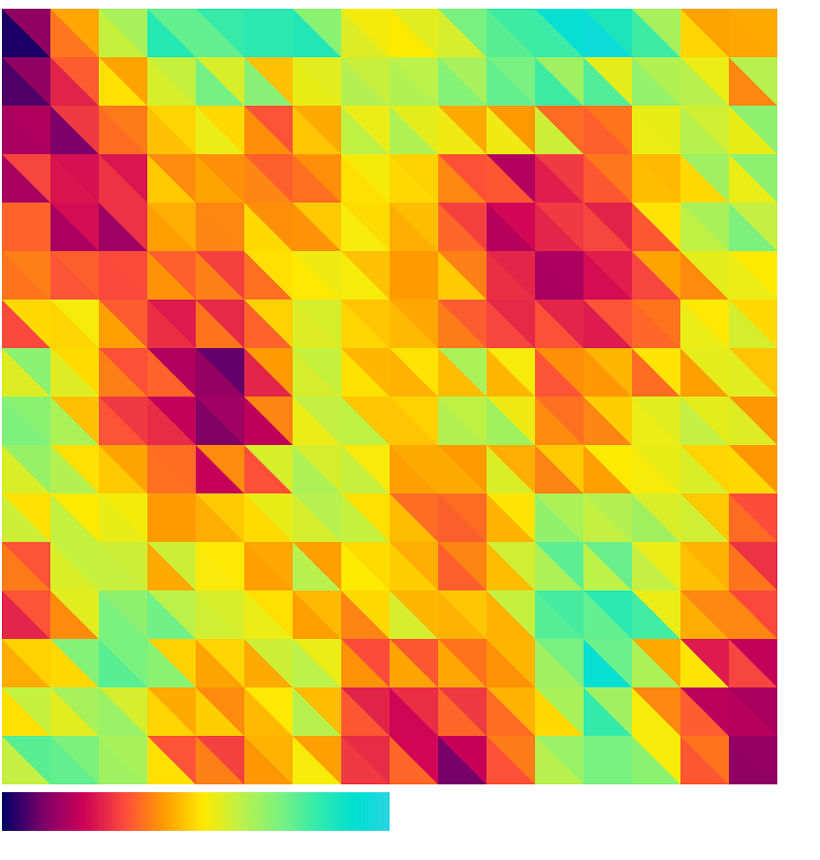
This is pretty, but I want more of a uniform colour scheme. I’m thinking I could make a linear gradient, and then pick colours from along that gradient.
I head to to my go-to tool for creating pretty gradients - Josh Comeau’s gradient generator and pick out some colours. I convert the hsl values given to hex values. I then create a second canvas on the page (on my own, without p5) and draw the gradient to it.
const gradientCanvas = document.getElementById("gradientCanvas");
const gradientCtx = gradientCanvas.getContext("2d");
const gradientColors = [];

makeGradient();

function makeGradient() {
  const gradient = gradientCtx.createLinearGradient(0, 0, 200, 0);
  gradient.addColorStop(0, "#000066");
  gradient.addColorStop(0.11, "#800068");
  gradient.addColorStop(0.21, "#cc0058");
  gradient.addColorStop(0.32, "#fd4e3a");
  gradient.addColorStop(0.42, "#ff9d00");
  gradient.addColorStop(0.52, "#ffea00");
  gradient.addColorStop(0.62, "#baf14b");
  gradient.addColorStop(0.72, "#79f181");
  gradient.addColorStop(0.82, "#2eeaaf");
  gradient.addColorStop(0.91, "#00e0d1");
  gradient.addColorStop(1, "#2bd4e3");

  gradientCtx.fillStyle = gradient;
  gradientCtx.fillRect(0, 0, 200, 20);
}
That creates a gradient that looks like this.

I then collect all the RGB values along the x axis of the gradient and store them in an array, using getImageData(). Now I have the colour at every pixel along this gradient canvas.
makeGradient() {
  //...
  const imageData = gradientCtx.getImageData(0, 0, 200, 1).data;

  for (let i = 0; i < imageData.length; i += 4) {
    gradientColors.push({
      r: imageData[i],
      g: imageData[i + 1],
      b: imageData[i + 2],
    });
  }
}
Now if I select one of the colours from my gradientColors for each of my triangles, I know they will fit my colour scheme.
I could use random to assign the colour values, but I want things to look a little more visually interesting, so I’ll use p5’s noise function instead. Here’s a great post on why you might want to use a noise function over random.
I update my makeTriangles array to give the triangle a color from the gradientColors array, based off their x,y position. For the second triangle in the grid,
function makeTriangles(x, y, size) {
  return [
    {
      x1: x,
      //... other co-ordinates
      xc: x + size * 0.25,
      yc: y + size * 0.5,
    },
    {
      x1: x,
      //... other co-ordinates
      xc: x + size * 0.75,
      yc: y + size * 0.5,
    },
  ];
}

function getColor(x, y) {
  const c = noise(x * 0.01, y * 0.01);
  let cI = map(c, 0, 1, -0.3, 1.3);
  if (cI < 0) cI = 0;
  if (cI > 1) cI = 1;
  return gradientColors[Math.floor(cI * (gradientColors.length - 1))];
}
Now my triangles are starting to look right.

I want this thing to animate though. I figure I can use a value for time and then pass that in to the noise function so the colour of each triangle changes over time.
There might be a more sophisticated way of getting the current time with p5, but I just decided to set the value to zero and then increment it a little on every draw call.
let time = 0;

function draw() {
	time += 0.01;
	if (time > 100) time = 0;
	//...
}
and then I update the getColor function to use the time value when it selects the colour.
function getColor(x, y) {
  const c = noise(x * 0.01, y * 0.01, time);
  //...
}
Finally, I decide I wanted more of a contrast between triangle 1 and triangle 2 of each triangle pair. So I offset the “colour position” of the second triangle by 3 triangle widths.
function makeTriangles(x, y, size) {
  return [
    {
      //...
      xc: x + size * 0.25,
      yc: y + size * 0.5,
    },
    {
      //...
      xc: x + size * 3.25,
      yc: y + size * 3.5,
    },
  ];
}
I’m pretty happy with that! So I hit publish. Here’s the finished Pen:
See the Pen p5.js sketch - triangles by Rachel Smith (@rachsmith) on CodePen.

Comments
proteus
May 13, 2023 at 3:56 PM
that is aesthetically so pleasing. thanks for creating it.
Leave a Comment
💯 Thanks for submitting your comment! It will appear here after it has been approved.