Creating a Habits Dashboard with Obsidian and the Dataview JS API
I’ve been tracking habits and other personal stats in my Obsidian daily notes for a few months now, using the Dataview Plugin’s inline field syntax.
Once filled out, my personal tracking info looks something like this.
## Tracking
---
sleep:: 7h10m
meditate:: y
journal:: y
walk:: y
yoga:: y
activity:: 3064
work:: -
food:: y
energy:: 4
mood:: 4
illness:: 0
write:: y
cycle:: n
I finally dug into doing something with this data using the Dataview JS API and I am pretty impressed with how powerful it is!
I created a script that:
- reads all the pages in the dailies folder
- uses the date of each to sort them into notes from the last 30 days, 60 days and 90 days
- figures out the percentage of days where I “completed” the habit from each time period
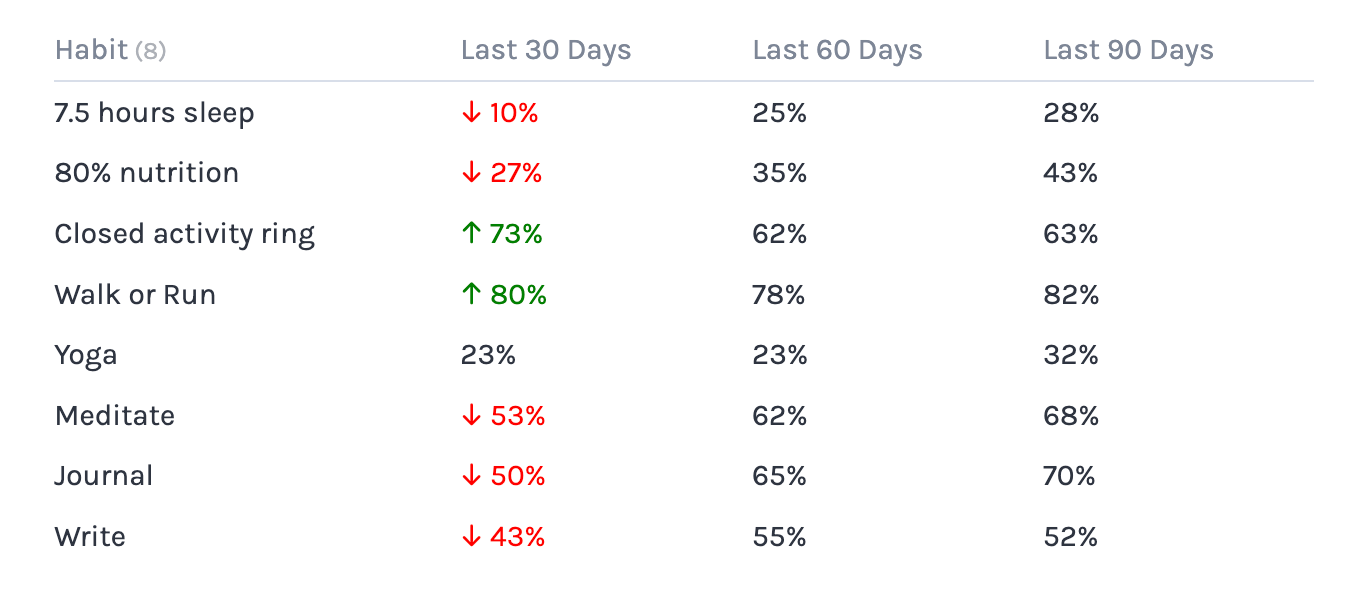
- renders out the percentages to a table
Now I can easily see which way my habits are trending: whether the last 30 days are following a positive or negative trajectory.
Here’s the full dataviewjs block. Hopefully, you’ll be able to follow it if you’re familiar with JavaScript. If not, feel free to ask me any questions.
const now = new Date(Date.now());
const todayDate = dv.date(now.toISOString().slice(0, 10))

const habits = [
	{title: "7.5 hours sleep", prop: "sleep", condition: (v) => v.values.hours >= 7 && v.values.minutes >= 30},
	{ title: "80% nutrition", prop: 'food'},
	{ title: "Closed activity ring", prop: 'activity', condition: (v) => v > 2300},
	{ title: "Walk or Run", prop: 'walk'},
	{ title: "Yoga", prop: 'yoga'},
	{ title: "Meditate", prop: 'meditate'},
	{ title: "Journal", prop: 'journal'},
	{ title: "Write", prop: 'write'}
];

const timeScales = [30, 60, 90];
const timeScaleTitles = timeScales.map(days => `Last ${days} Days`);
const pages = dv.pages('"dailies"');

function dailyIsWithinDays(daily, days) {
	return dv.date(daily.file.name) >= (todayDate - dv.duration(`${days} days`));
}

const dailiesInTimeScale = timeScales.map(ts => pages.where(p => dailyIsWithinDays(p, ts)));

const habitRows = habits.map(habit => {
	const percentages = timeScales.map((ts, i) => {
		const dailies = dailiesInTimeScale[i];
		const habitCount = dailies.filter(p => {
			const value = p[habit.prop];
			if (!value) return false;
			if (habit.condition) return habit.condition(value)
			return value === 'y';
		}).length;
		return Math.round(habitCount/ts*100)
	});
	// add emoji to first percentage
	const percentageText = percentages.map((percentage, i) => {
		if (i === 0) {
			if (percentage > percentages[1]) return `<span style="color: green;">↑ ${percentage}%</span>`;
			else if (percentage < percentages[1]) return `<span style="color: red;">↓ ${percentage}%</span>`;
		}
		return `${percentage}%`;
	});
	return [habit.title, ...percentageText]
})

dv.table(
	["Habit", ...timeScaleTitles],
	habitRows
)
Here’s what my table looks like today:


Comments
Albertus
January 2, 2024 at 2:55 PM
This is amazing, thanks for sharing, Rach!
Brandon
June 29, 2024 at 2:44 AM
Can you show how you would use energy, mood, and illness in your top example of habits? Or better yet, have nested habits (in frontmatter) such as:
Habits:
Leave a Comment
💯 Thanks for submitting your comment! It will appear here after it has been approved.